Business Rates Revaluation: 2026 Handbook
Download PDF
The research uses the established benchmark of the Quarterly MSCI UK Property Index, which contains £24.8bn of retail properties, £26.8bn of offices and £40.7bn of industrial & logistics. This provides valuation-based estimates of market rental growth, broken down by segment and location, over the three years to 1 April 2024 by sector.
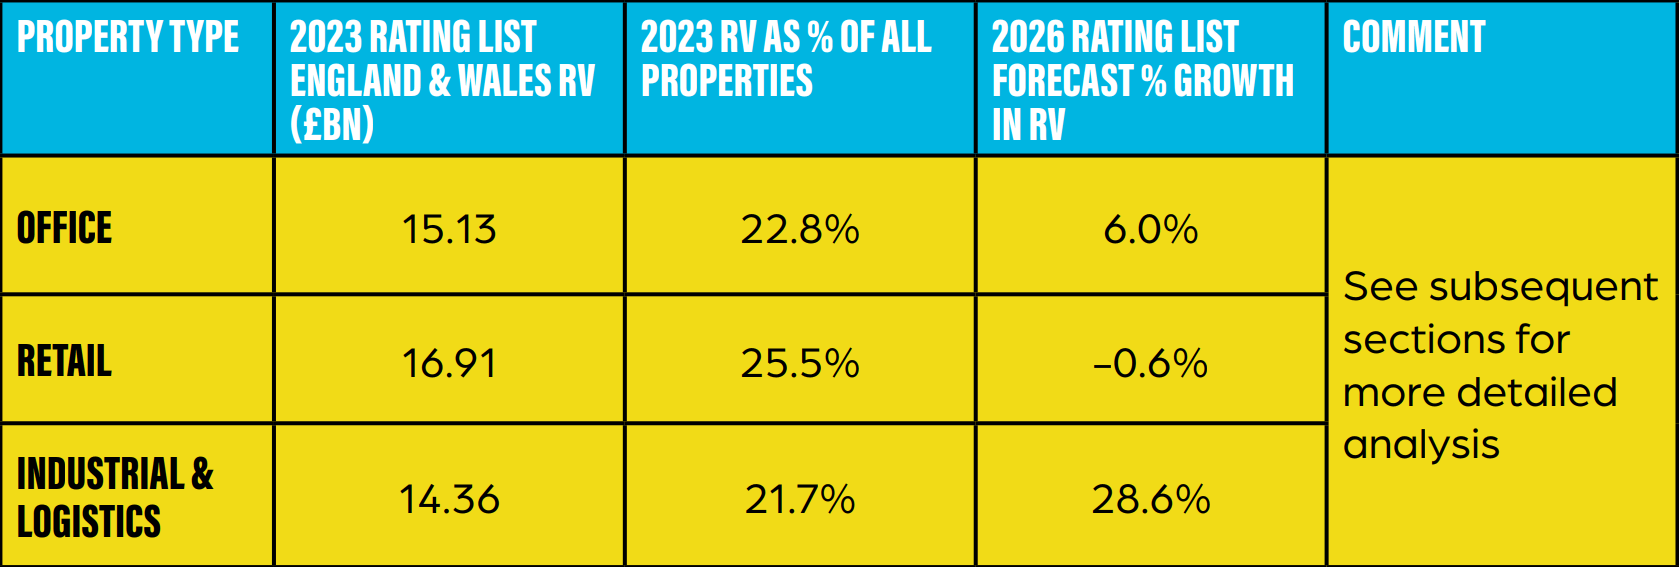
The segments show very divergent patterns, a result of the impact of various broader movements on the differing property markets and geographies. In broad terms, logistics, driven by the growth of online retail and the move to greater inventories, has seen very strong rental growth; offices has seen positive, but very modest growth (behind inflation); and retail is still falling, albeit modestly and with a divergence between a relatively robust out-of-town and a more troubled in-town segment.
Within the following pages, we do not address likely value movement for properties valued with reference to build cost or profit (and this range of properties is extensive) however, we do anticipate:
Properties valued with reference to their land and build costs – likely to see above-inflationary increases reflecting a number of factors, primarily:
Properties valued with reference to their profitability – often linked to properties with a high degree of public interaction, 2021 values frequently reflected Covid restrictions and consequential trading impact. April 2024 values will reflect the post-Covid bounce back, which is likely to mean significant increases for many.
Understanding rateable value and multiplier movement is critical in forecasting likely movement in liability at individual property and portfolio levels.
The VOA will publish the Draft Rating List in late 2025, which will be the first time it publicly reveals its views on value levels at a local, regional and national level.
Until this stage, it is not possible to predict individual property values accurately. Instead, the following pages provide greater clarity in respect of likely trends in regional and national value movement and consequential rate multipliers using averages across a broad range of properties.
In summary, we forecast an overall weighted increase in value of 9.1% across the prime property classes: office, retail and industrial & logistics.
Notwithstanding the above, we anticipate that the overall % growth in the aggregate rateable value included in the Rating List to be greater than this, reflecting additional sectors not listed above and specifically those valued with reference to their build cost or profitability. As a result, we estimate that the overall increase will be in the range of 12.5%-15%.
The conclusions of our research are explored in more detail on the following pages.
The current standard multiplier is 55.5p/£ (49.9p/£ where the RV is less than £51,000).
The Revaluation will rebase the multiplier to reflect national movement in rateable values.
The general principle in resetting the multiplier is that other than to reflect inflation, the process should be revenue neutral, ie Treasury collecting the same amount in real terms in 2026/7 as they had in 2025/6 (the last year of the 2023 Rating List).
Assuming an overall increase in Rateable Value of say 15% and reflecting current CPI inflationary levels we are predicting a standard rate multiplier of approximately 50p.
It is important to note that lower multipliers currently exist for properties with RVs below £51,000 and individual property liabilities will be impacted by reliefs and supplements; for 2026 there will be the added complication of differential multipliers.

Download PDF